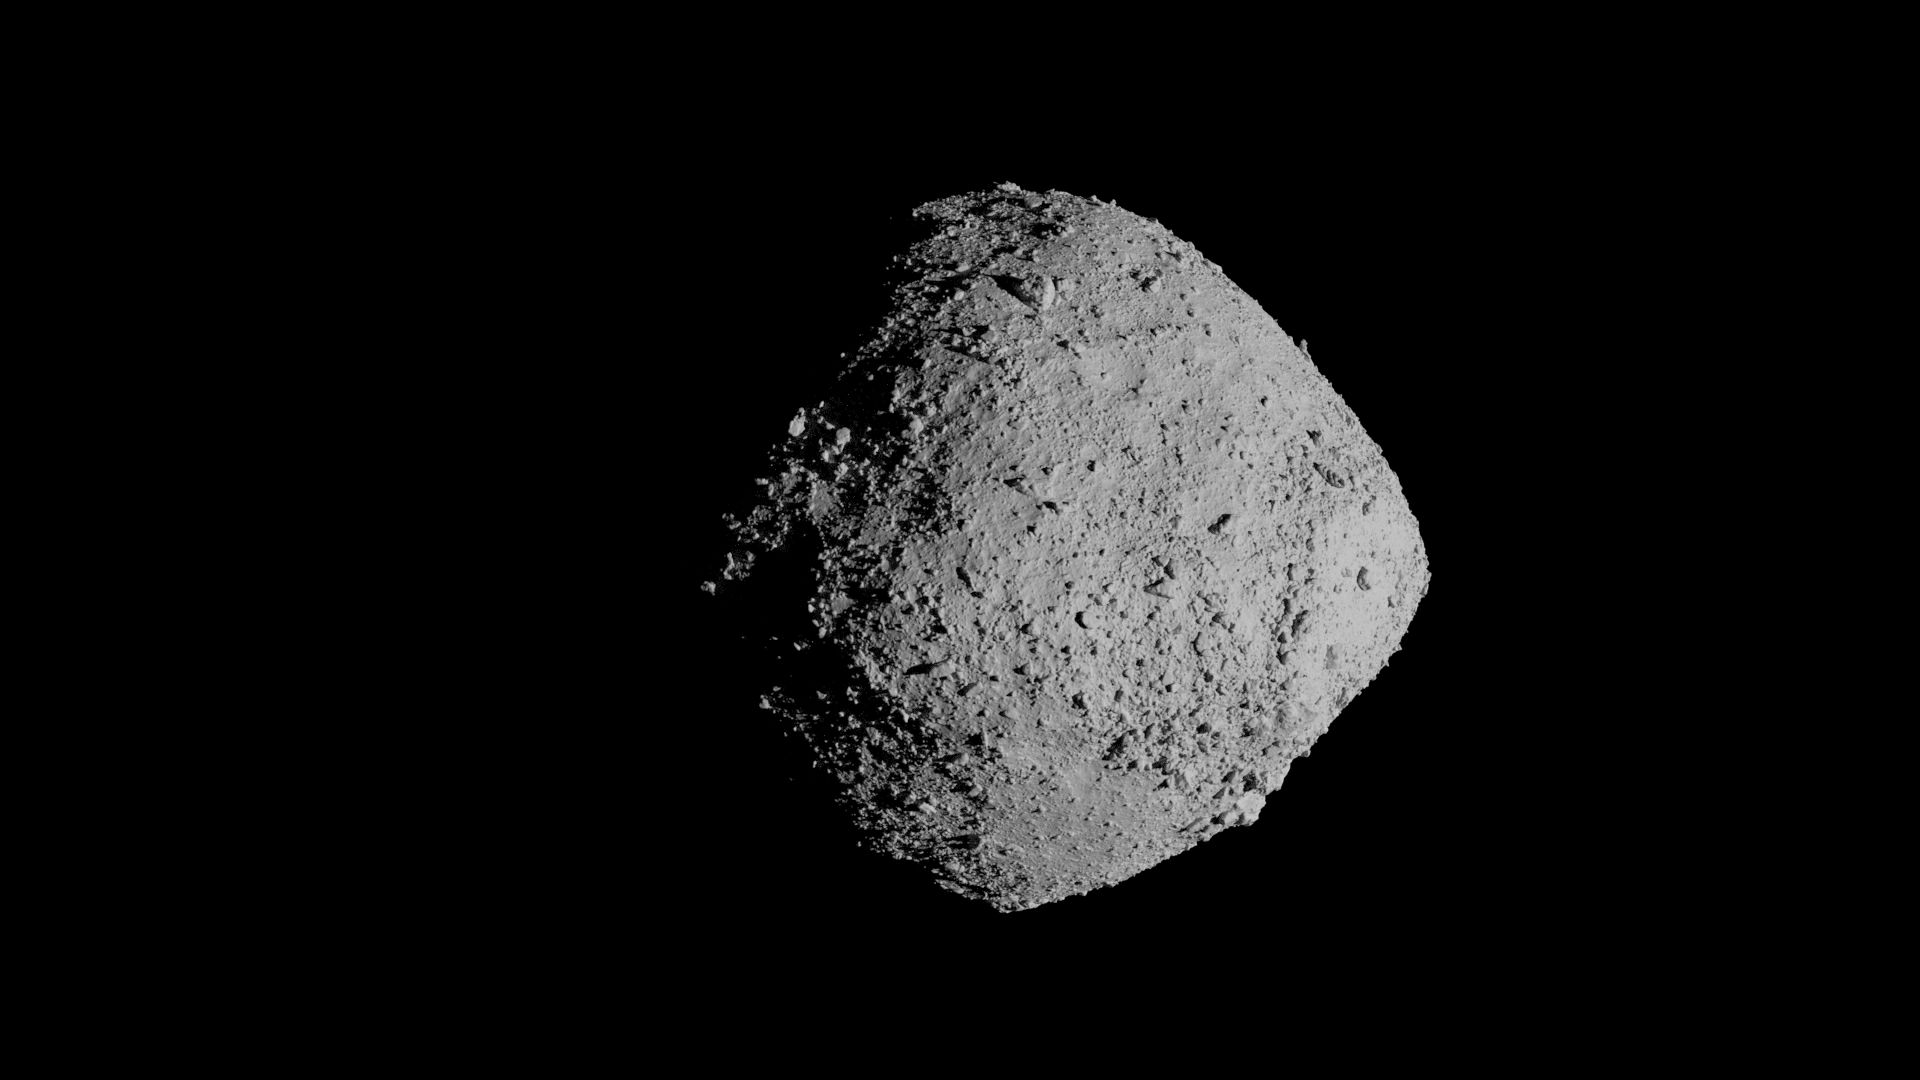
3D Models of the Asteroid Bennu.
The 3D models and images presented here were constructed using data gathered by NASA’s OSIRIS-REx spacecraft during its orbit around asteroid Bennu. These models were utilized in various visualizations, including the Tour of Asteroid Bennu, Detailed Global Views of Asteroid Bennu, and Bennu TAG Surface Change, produced by the Scientific Visualization Studio (SVS). Additional 3D models can be accessed through the JHUAPL Small Body Mapping Tool (SBMT), encompassing 5cm resolution tiles that cover the entire asteroid (only the sample site tile is displayed here due to storage limitations).
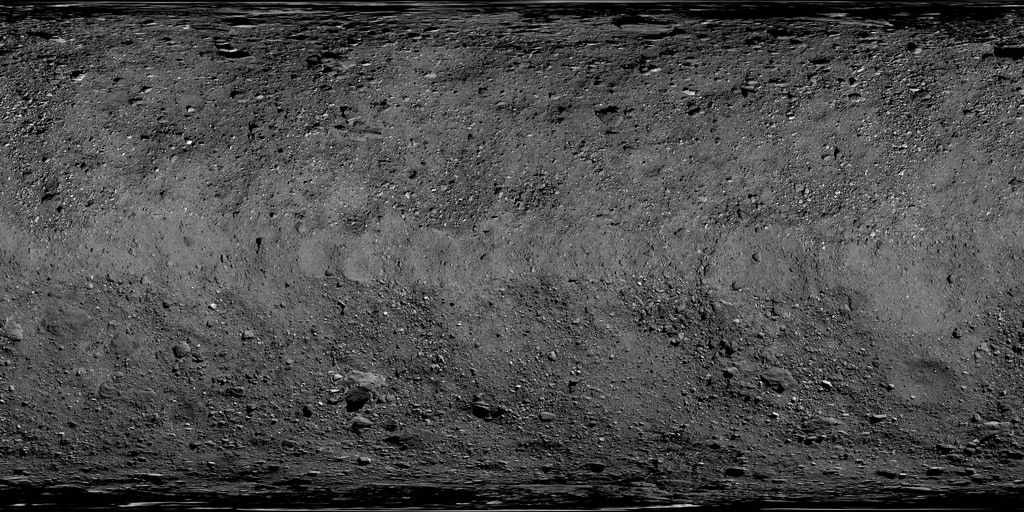
The global map of asteroid Bennu’s surface depicted here is a mosaic created from images collected by the OSIRIS-REx spacecraft between March 7 and April 19, 2019. A total of 2,155 images captured by the PolyCam camera were stitched together and adjusted to produce this mosaic. With a resolution of 2 inches (5 cm) per pixel, this represents the highest-resolution global mapping of a planetary body to date. The images were obtained from distances ranging between 1.9 to 3.1 miles (3.1 to 5 km) above the asteroid’s surface. Further details on the creation of the basemap can be found in the publication “A high-resolution global Basemap of (101955) Bennu” by Bennett et al. in Icarus (2020).
The Bennu albedo map was generated using images acquired by the PolyCam camera during the Baseball Diamond Flyby 1. These images were normalized photometrically to accurately represent the inherent albedo of Bennu’s surface. More information on the creation of the albedo map can be found in the publication “A High-Resolution Normal Albedo Map of Asteroid (101955) Bennu” by Golish et al. in Icarus (2020).
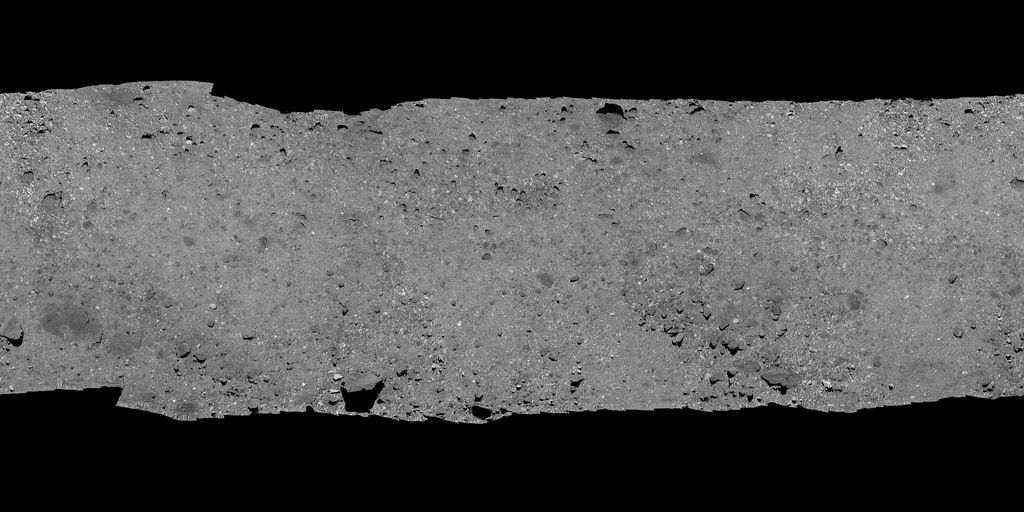
Polar regions that were not imaged during Flyby 1 are visualized using the Bennu global basemap, which was created using PolyCam images obtained during Baseball Diamond Flybys 3 and 4.
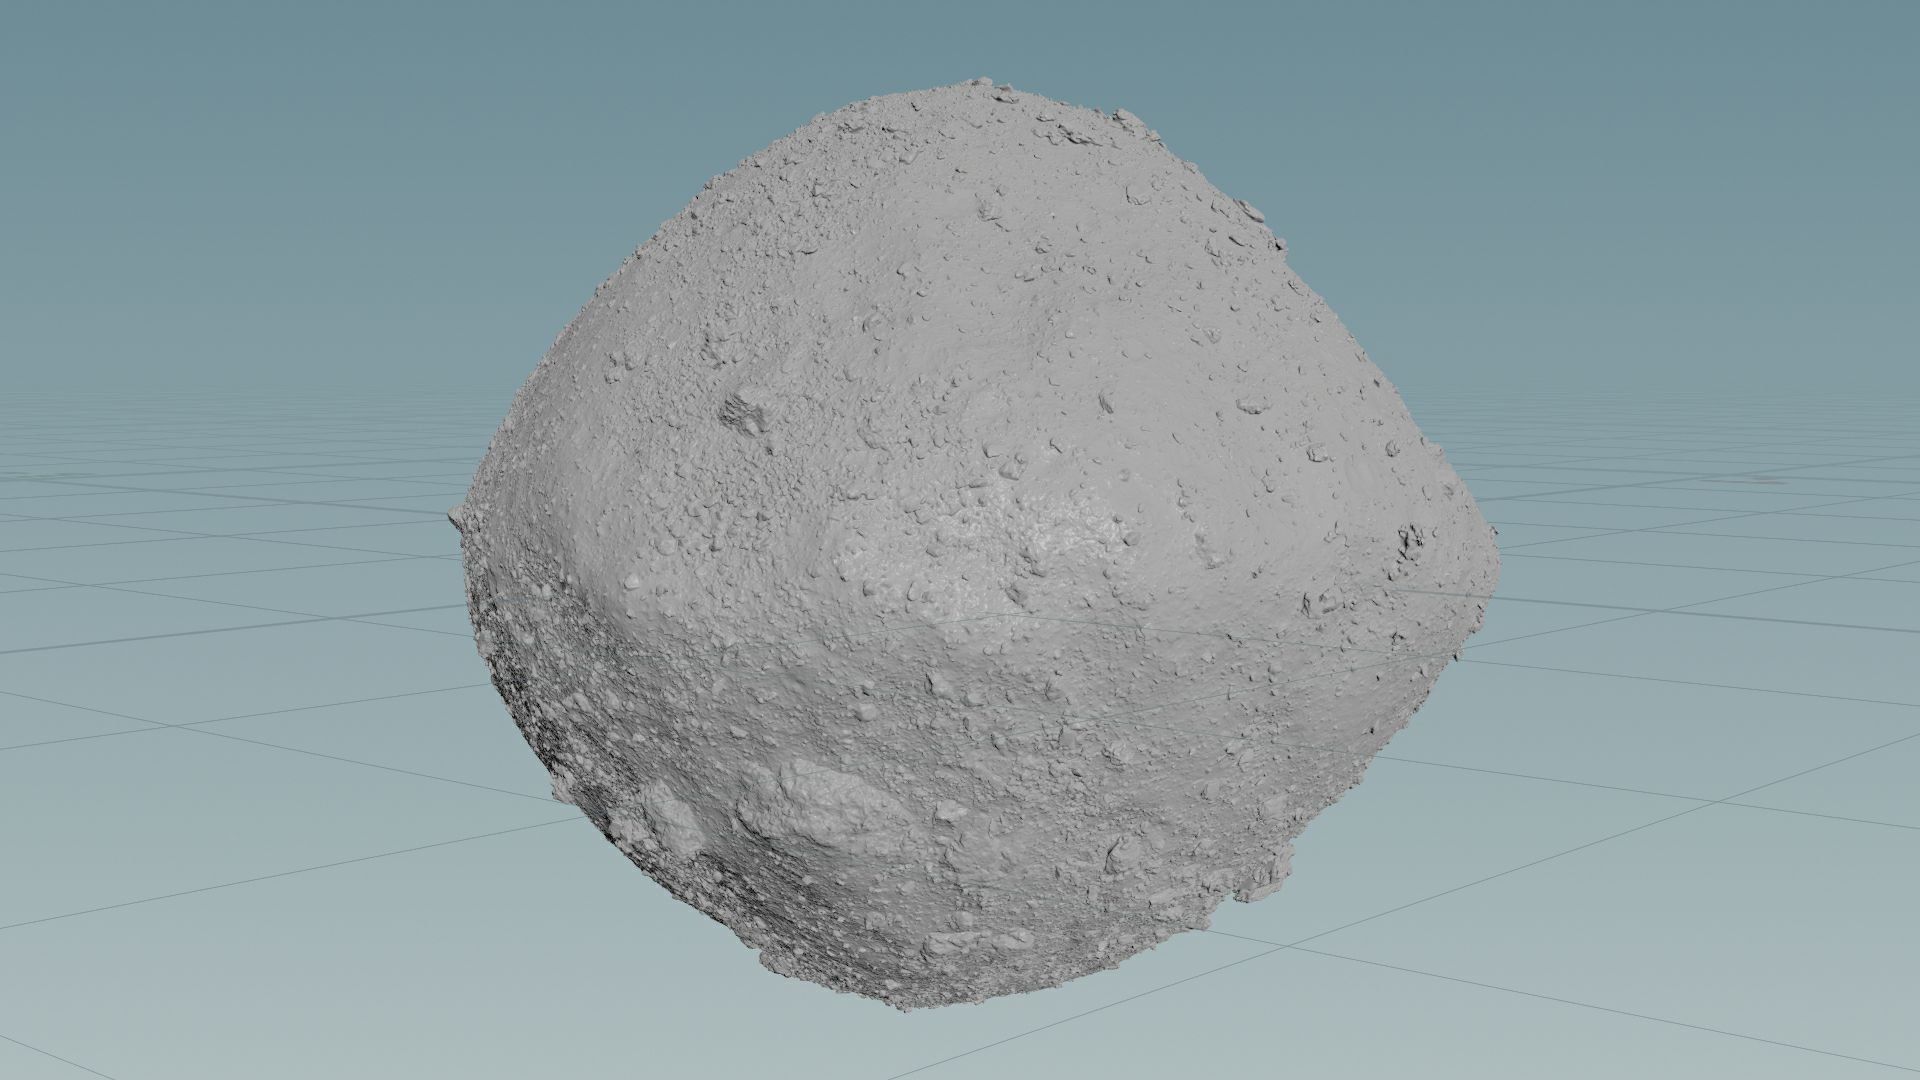
In the SVS Bennu visualizations, the two images mentioned above were mapped onto the 3D models using a spherical UV mapping projection. This projection technique is based on wrapping a spherical shape around the mesh, ensuring accurate placement of the images. To achieve the highest resolution texture while maintaining global coverage, the albedo map was applied as the top texture layer, while the global image mosaic was placed beneath to fill the polar regions.
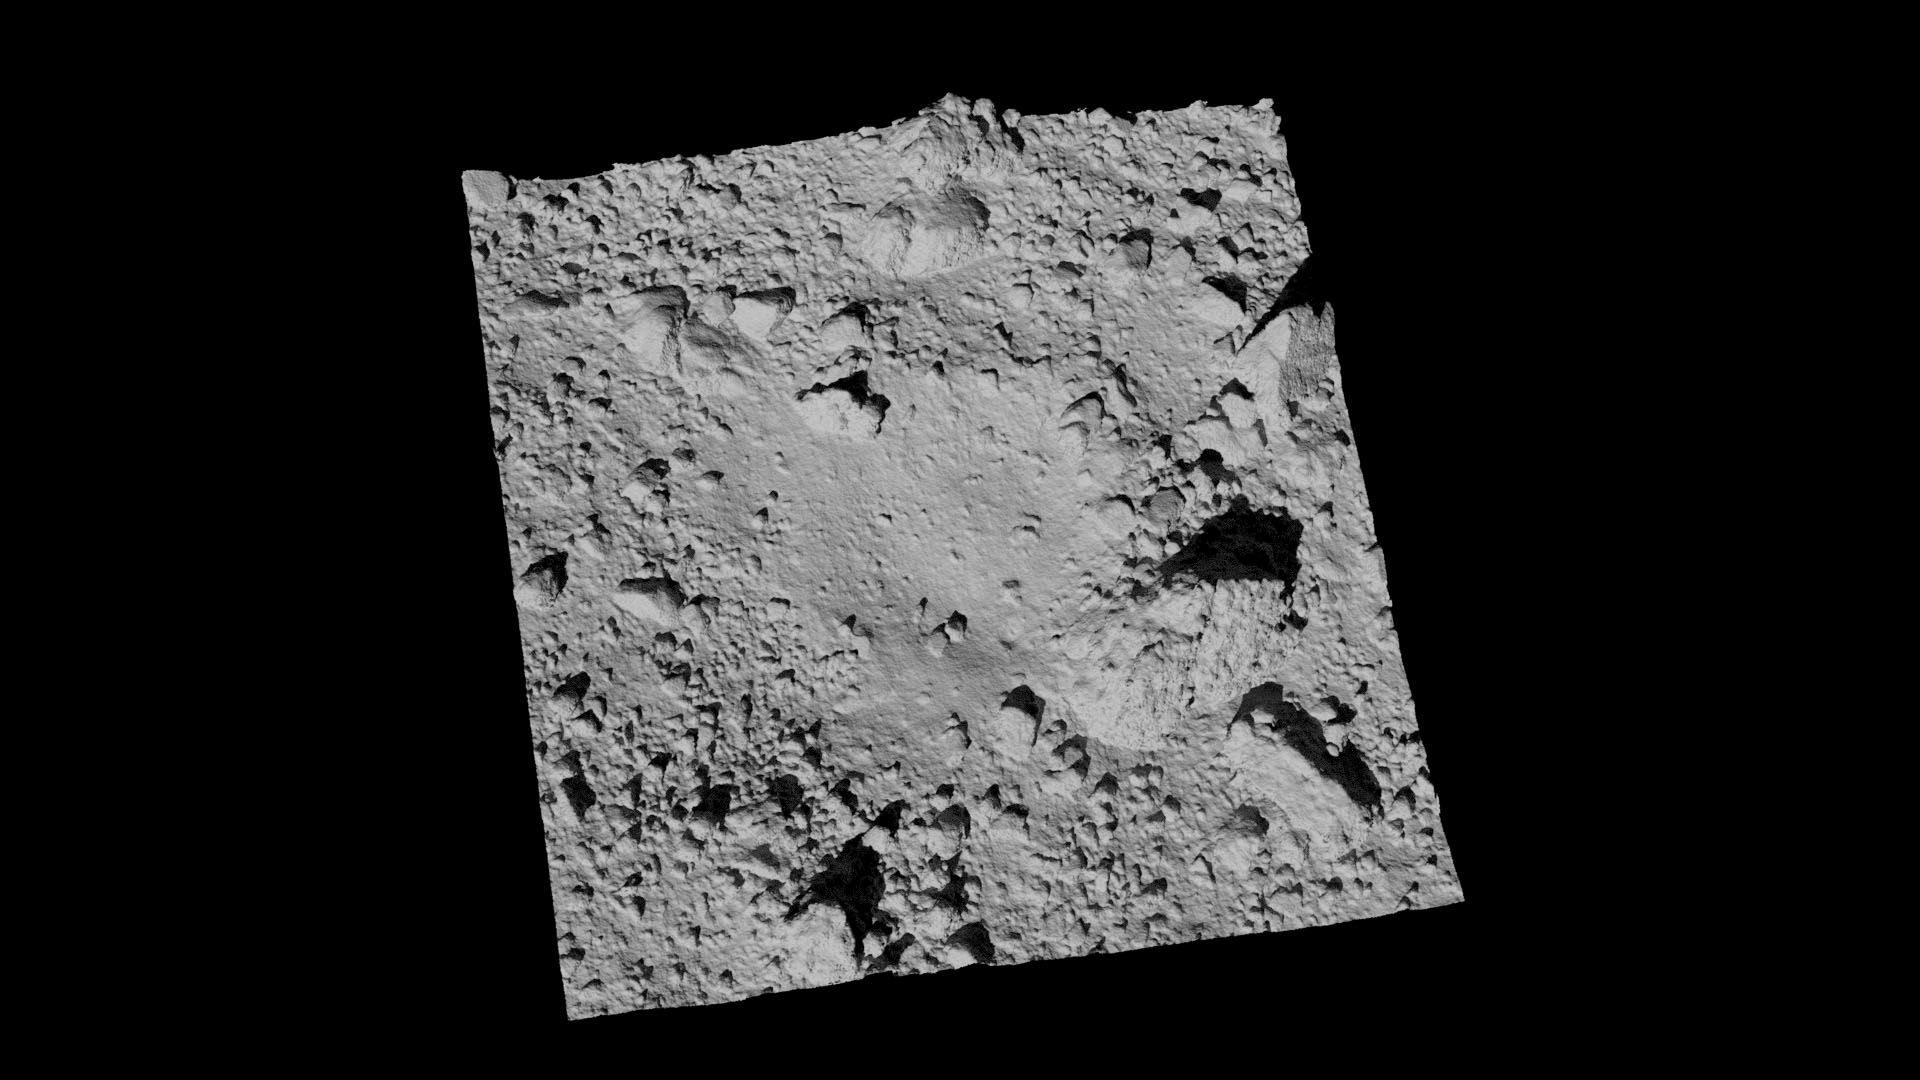
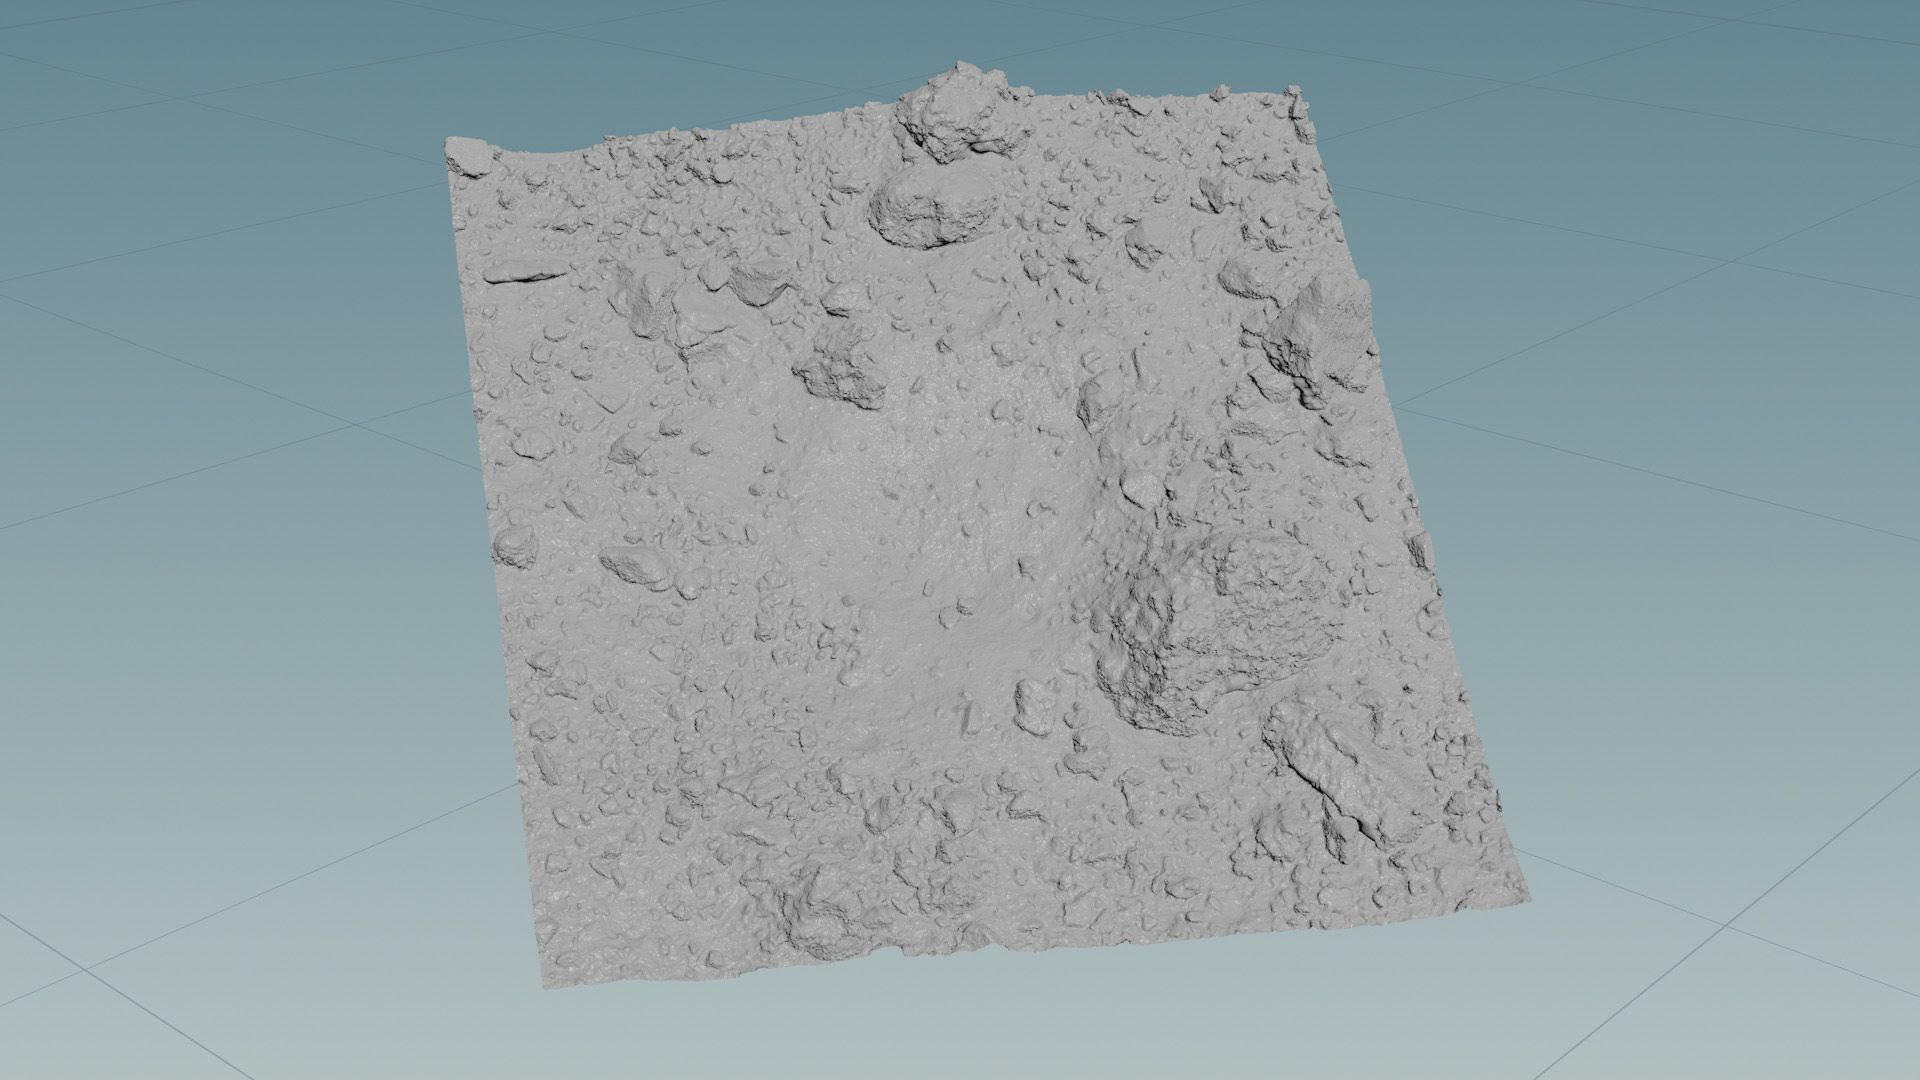
The subsequent two models represent versions of the 5cm resolution sample site tile prepared for 3D printing. These models were modified to include added thickness, centered positioning, and adjusted scale. The “After TAG” model was created by displacing the mesh vertices of the “Before TAG” model using pre- and post-TAG surface height change data. However, it should be noted that this offset is only applied within a 7.5-meter range from the impact site, as the accuracy of the data decreases further away from the impact area.

Hits: 0